Integrating Genetics and the Social Sciences (IGSS) Conference
  • Home
  • Resources
    • Past Primer & Workshops
      • 2025
    • Past Speakers
      • 2025
      • 2024
  • Program
  • Sessions
  • General Info
    • Transportation
    • Accommodations
    • Restaurants

Primer II | GWAS, Genetic Ancestry, & PGIs

Workshop II | GWAS, Genetic Ancestry, & PGIs

By Nicole Gladish, 1 yearAugust 19, 2025 ago
  • Home
  • Resources
  • Program
  • Sessions
  • General Info
Hestia | Developed by ThemeIsle

Half in Expectation, Not in Fact: Realized Genetic Relatedness and the Adult Sibling Bond

Conley D, Zhang L, Taddess B


Corresponding author: Dalton Conley
Corresponding author email: daltonclarkconley@gmail.com

Short Abstract

Full siblings share half their genomes in expectation, not in fact: meiosis leaves realized identity-by-descent (IBD) sharing varying around 0.50 with a standard deviation near 0.04. Using 2,119 genotyped full-sibling dyads from the Wisconsin Longitudinal Study, observed from midlife into later life, we ask whether that variation predicts the adult sibling relationship. It does, selectively. Higher realized sharing predicts greater perceived similarity in outlook, more frequent contact, a higher composite relationship-quality score, and larger financial transfers. It does not predict affective closeness, geographic proximity, or whether a large transfer occurred at all. Adjustment for sibling differences in polygenic indices leaves the estimates largely unchanged, which locates the effect outside the traits those indices capture rather than ruling out confounding. Because no recognition system registers genome-wide IBD, the gradient must operate through unobserved phenotypic resemblance. The contribution is to move the unit of genetic analysis from the individual to the dyad.

From Polygenic Scores to Genetic Networks: Integrating Genome-Wide Genetic Relationships and Social Risk Factors in Depression Prediction

Geurgas R1,*, Arirangan S1, Wedow R1,2,3,4


1Department of Sociology, Purdue University, USA
2Department of Statistics, Purdue University, USA
3Center on Aging and the Life Course (CALC), Purdue University, USA
4Department of Medical and Molecular Genetics, Indiana University School of Medicine, USA

*Presenting author: Rafael Geurgas
Corresponding author email: rgeurgas@purdue.edu

Short Abstract

Major depressive disorder (MDD) is a heterogeneous condition shaped by the interplay of social, behavioral, health-related factors, and genetics. Predictive models that incorporate genetic information, however, commonly represent genetic liability using polygenic scores (PGS), thereby reducing genome-wide variation to a small set of individual-level summary measures. In previous work using the National Longitudinal Study of Adolescent to Adult Health (Add Health) and the All of Us Research Program, we found that environmental and social predictors provided substantial predictive information for depression, whereas adding PGS did not meaningfully improve predictive performance. These findings suggest a limited contribution of PGS in this context. This does not necessarily indicate a limited role for genetic information in prediction models; instead, it may reflect how genome-wide information is represented. This motivates an alternative question: rather than using individual-level polygenic scores to improve prediction, can predictive models make greater use of the genome-wide genetic information?

We propose a network-based framework that represents genetic similarity using a genome-wide genetic relationship matrix (GRM) and integrates this structure with individual-level social, behavioral, demographic, and health characteristics. In this framework, individuals constitute network nodes and pairwise genetic similarity defines the edges connecting them. Node features capture characteristics relevant to depression, including mental and physical health, social relationships, and socioeconomic conditions. A graph neural network (GNN) is then used to learn representations that incorporate both information about each individual and information propagated through the genetic network.

The proposed framework provides a direct way to examine whether genome-wide genetic relationships contain predictive information not captured by PGS, while simultaneously modeling the social and environmental characteristics associated with depression. Network representation allows genetic similarity to serve as the model’s structural component, while individual-level characteristics provide the substantive features used for prediction. The approach therefore offers a framework for studying depression as a multidimensional outcome in which genetic relatedness and social context can be incorporated into the same predictive architecture.

Although graph-based approaches have been increasingly applied to depression and genetic relatedness has been incorporated into genomic prediction, the use of genome-wide genetic relationships as network structure while simultaneously integrating social, behavioral, and health characteristics for depression prediction remains largely unexplored. This framework provides an alternative method for integrating genome-wide genetic information with social and health characteristics, enabling genetic similarity among individuals and their broader contexts to be modeled within a unified predictive architecture.

A summary-statistics framework for systematic benchmarking of epigenetic clock-phenotype associations

Wu Y1,†, Wang Y1,†, Moreno R1, Schmitz LL2, Lu Q1,*


1Department of Biostatistics and Medical Informatics, University of Wisconsin-Madison, Madison, WI, USA
2Robert M. La Follette School of Public Affairs, University of Wisconsin-Madison, Madison, WI, USA

†These authors contributed equally to this work
*Presenting author: Qiongshi Lu
Corresponding author email: qlu@biostat.wisc.edu

Short Abstract

Epigenetic clocks have emerged as powerful biomarkers of biological aging and are increasingly used to investigate health, lifestyle, environmental exposures, disease, and mortality. However, different clock models can show modest correlations and substantially different associations with the same phenotype, making it unclear which clocks capture shared dimensions of biological aging versus distinct biological processes. Systematic benchmarking across large numbers of phenotypes is currently constrained by the need for individual-level DNA methylation (DNAm) data, which are often difficult to access and computationally intensive to analyze. Meanwhile, thousands of epigenome-wide association studies (EWAS) have generated publicly available summary statistics describing associations between CpG methylation and diverse human traits and exposures. Yet, no existing framework enables these CpG-level summary statistics to be translated into epigenetic clock–phenotype associations.

To address this major gap in the literature, we developed REMORA, a summary-statistics-based framework for estimating associations between epigenetic clocks and phenotypes without requiring individual-level DNAm data. REMORA integrates three sources of information: (1) EWAS summary statistics describing CpG-level associations with a phenotype, (2) published epigenetic clock weights, and (3) a reference DNAm dataset used to estimate the covariance structure among CpGs included in the clock. Using these inputs, REMORA reconstructs clock–phenotype regression coefficients and their standard errors from summary statistics alone. The framework accommodates covariate-adjusted analyses and complex phenotypes, including binary and survival outcomes, and can account for EWAS analyses performed using transformed DNAm measures.

We first evaluated REMORA using simulated data and then performed empirical validation using numerous data resources. We analyzed 36 epigenetic clocks spanning models trained to predict chronological age, gestational age, biomarkers and mortality, pace of aging, cell division, and specific diseases or complex traits. Clock associations were evaluated for four phenotypes: height, body-mass index, anxiety, and high blood pressure. We subsequently applied REMORA to publicly available EWAS summary statistics for chronological age, smoking, and 24 disease outcomes, including 14 incident and 10 prevalent diseases from Generation Scotland. In all empirical validations, REMORA estimates based exclusively on summary statistics were nearly identical to associations obtained using conventional individual-level DNAm analyses across 36 clocks and four phenotypes. Importantly, REMORA also accurately recovered covariate-adjusted associations, demonstrating that summary-statistics-based inference can reproduce results that would otherwise require access to individual-level methylation data. Applying REMORA to publicly available EWAS data demonstrated its utility for large-scale benchmarking of epigenetic clocks. Across EWAS of chronological age and smoking, we identified widespread and heterogeneous clock associations across clock model classes. We identified 118 significant clock–prevalent disease associations at false discovery rate (FDR) <0.05, including 75 associations surviving Bonferroni correction, and 134 significant associations with incident diseases, including 88 surviving Bonferroni correction. Associations with incident disease were highly concordant with those observed for prevalent disease (correlation = 0.82). Clock performance varied substantially by model class. Chronological-age clocks showed particularly strong associations with diabetes but generally weaker associations with other diseases than second- and third-generation clocks. Disease-specific clocks displayed mixed performance, with some showing strong but nonspecific associations. Notably, Alzheimer’s disease showed little evidence of association with the epigenetic clocks examined, despite adequate EWAS sample size, suggesting that currently available clock models may capture epigenetic signatures of cardiovascular, metabolic, and immune disease processes more effectively than neurodegenerative processes.

REMORA enables accurate estimation of epigenetic clock-phenotype associations using only publicly available EWAS summary statistics, clock model weights, and reference methylation covariance information. By eliminating the requirement for individual-level DNAm data, REMORA transforms the rapidly expanding collection of EWAS summary statistics into a scalable resource for systematic evaluation of epigenetic aging biomarkers. This framework provides a foundation for benchmarking existing and emerging epigenetic clocks across hundreds of health, behavioral, environmental, and disease phenotypes, while distinguishing broadly shared aging-related signals from clock- and phenotype-specific associations. REMORA therefore establishes a new summary-statistics-based paradigm for large-scale investigation of the biological meaning and utility of epigenetic clocks.

Identifying overlapping samples in the PGS cohort using only GWAS summary statistics

Wu Y1,*, Lin I-J1, Wu Y1, Lu Q1


1Department of Biostatistics and Medical Informatics, University of Wisconsin-Madison, Madison, WI, USA

*Presenting author: Yuchang Wu
Corresponding author email: ywu423@wisc.edu

Short Abstract

Background: The emergence of large-scale biobanks has made sample overlaps between genome-wide association study (GWAS) and polygenic score (PGS) cohorts unavoidable, ubiquitous, and intractable. These undetected overlaps lead to flawed statistics, notably inflating type-I errors and R2 values in downstream PGS regression inferences. Existing solutions remain unsatisfactory as they either yield biased results, require access to individual-level data for the GWAS cohort, or impose expensive computational burdens. This study proposes a novel and yet simple statistical solution to identify overlapping samples using only GWAS summary statistics and Gaussian mixture models (GMM).

Method: The proposed framework first computes PGS using GWAS summary statistics and then utilizes a GMM combined with the Expectation-Maximization (EM) algorithm to distinguish the distributions of overlapping versus non-overlapping samples. Theoretical derivation shows that samples at the extreme tails of the PGS distribution are more likely to be overlapping samples, while samples at the extreme tails of the residuals from a Y ~ PGS + covariates regression are more likely to be non-overlapping. The EM algorithm estimates the means, variances, and mixing proportions of these underlying groups to compute the posterior probabilities of overlap. We tested four input variations: PGS-only, residuals-only, combined PGS and residuals, and an “ensemble” approach that averages posterior probabilities from the PGS and residual models.

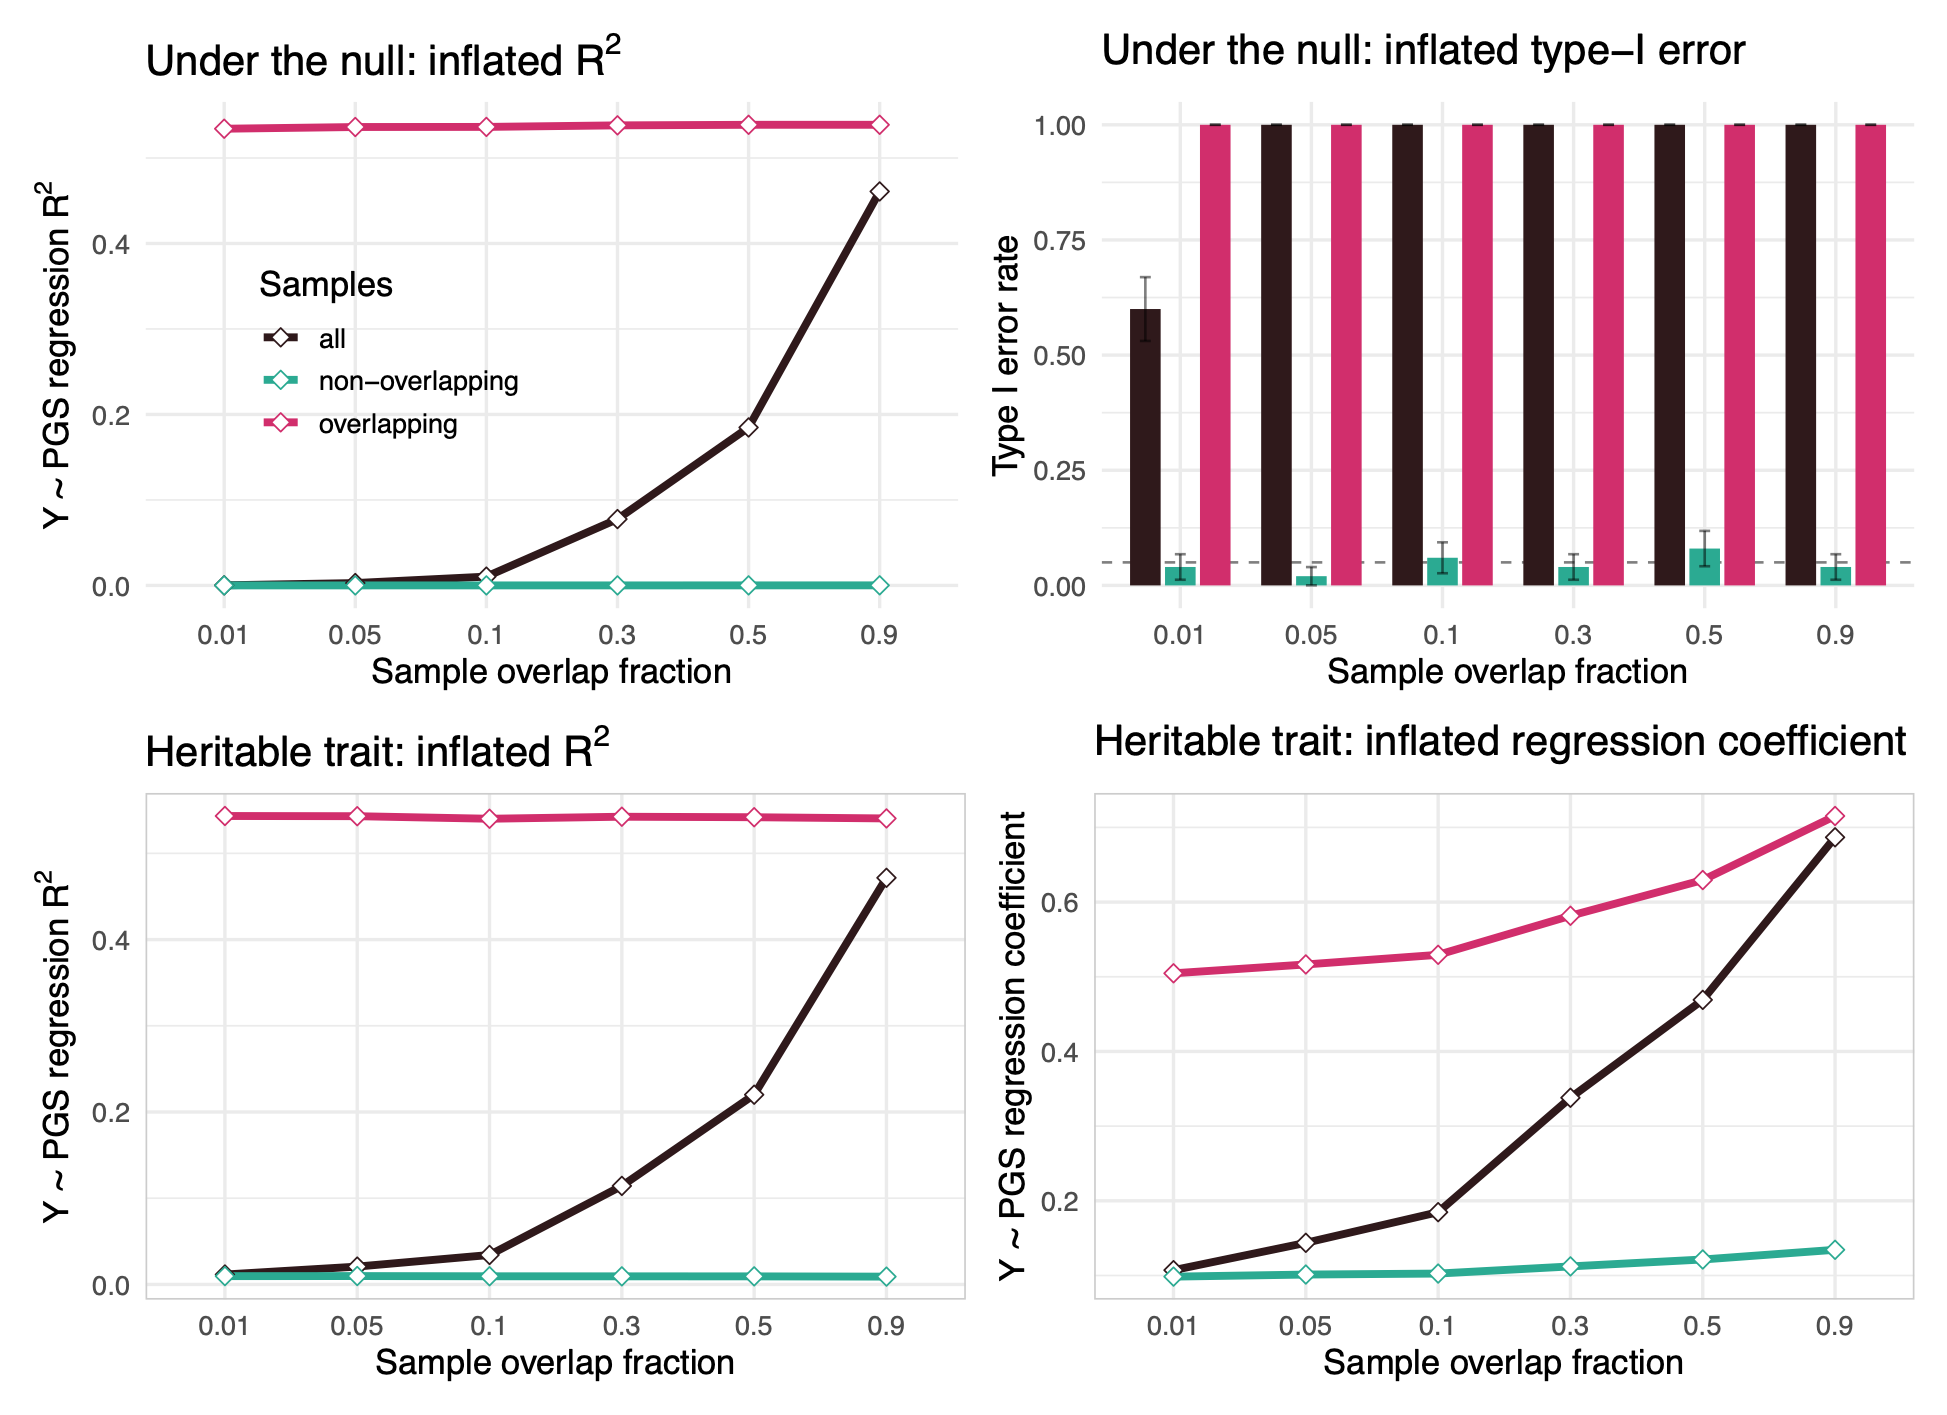
Preliminary result: Simulations based on real genotype data demonstrated that sample overlap substantially inflates R2 and type-I error rates in PGS regression analysis. The proposed EM-GMM approach achieved a high area under the curve (AUC) for identifying overlapping samples across a wide range of simulation settings. Crucially, excluding the likely overlapping samples successfully corrected the inflated R2 in the PGS regression. In real data applications evaluating overlaps between ALSPAC and UK Biobank (UKB) cohorts, the algorithm successfully separated the UKB samples into two distinct groups. It estimated plausible overlapping subset sizes (~800 individuals) that align closely with estimates based on individual-level demographic variables. While the algorithm is highly stable in most settings, it can struggle when the overall GWAS sample size is excessively large or when the overlap fraction is very small.

Conclusion: The proposed EM-GMM framework provides a robust, accessible solution to the intractable problem of cohort overlap. It achieves high AUC without requiring corresponding phenotype or individual-level genotype data from the GWAS cohort. Future work will explore alternative statistical (such as those with distinct means for overlapping versus non-overlapping samples) and to improve performance when GWAS summary statistics have massive sample sizes.

Simulation results showing that sample overlap between GWAS and PGS cohorts inflates Y ~ PGS regression R-squared, type I error rate, and regression coefficients, shown under the null and for a heritable trait across overlap fractions from 0.01 to 0.9.
Figure 1. Simulation studies on the effect of sample overlaps. Inflated Y ~ PGS regression R2, type I error rates, and effect size estimates due to sample overlap between GWAS and PGS cohort.

Two Biases, Two Corrections: Sample-Corrected Within-Family GWAS of Educational Attainment in All of Us

Martin-Bassols N1,*, Cole S1, Galama T1


1Center for Economic and Social Research (CESR), University of Southern California

*Presenting author: Nicolau Martin-Bassols
Corresponding author email: nmb_885@usc.edu

Short Abstract

Polygenic indices underpin a growing body of research across the social and biomedical sciences, but the GWAS coefficients behind them are contaminated by two distinct biases. First, biobanks are volunteer samples: participation is correlated with educational attainment (EA), so conditioning on being in the sample induces collider bias that attenuates genetic associations. Second, a population GWAS coefficient bundles the direct effect of a person’s own genotype with indirect, between-family channels — genetic nurture, assortative mating, and stratification. Each bias has a known fix — inverse-probability weighting for volunteer selection, and a within-family design for indirect effects — but the two have only ever been applied separately. We ask whether recovering the population-representative direct genetic effect takes one correction or two, and whether the corrections interact.

We study EA in the All of Us Research Program (European-ancestry subset). Volunteer-bias weights, which reweight the sample to a US census benchmark, are built two independent ways (LASSO inverse-probability weighting and raking) that yield near-identical weights; the within-family design uses parental genotypes imputed from offspring, available for 14,027 genotyped offspring in 9,913 reconstructed families. We estimate the genetic effect on EA under each correction and, crucially, cross the two on a single common sample so that any two estimates differ by exactly one correction.

We first correct for volunteer bias in the full sample. Reweighting to the census benchmark raises EA effect sizes by roughly 24% (sample-corrected GWAS versus standard GWAS, slope 1.243 [1.236, 1.251]), consistent with the literature and replicating in a US cohort the direction van Alten et al. (2025) report in the UK Biobank. We then expand the analysis with the within-family design, crossing both corrections on the common sample of 14,027 offspring. Normalizing the uncorrected population estimate to 1.0, weighting alone raises effects to 1.15, the within-family design alone lowers them to 0.77, and applying both lands at 0.93 — our estimate of the representative direct effect. The lift from weighting is the same factor in both rows and the shrink from the family design the same factor in both columns, so the two corrections are approximately multiplicative and separable: they act on orthogonal axes. SNP-by-SNP slopes confirm it (weighting 1.149 [1.125, 1.174]; within-family 0.771 [0.753, 0.789]).

The two biases oppose each other — weighting raises EA effects while the within-family design lowers them — and therefore partly cancel. As a result, an uncorrected GWAS can look reasonable while being wrong in both directions at once, and applying only one correction can move estimates further from the truth. The population-representative direct effect is recovered only by combining volunteer-bias weighting with the within-family design: they are complementary, not substitutes. Because the within-family arm (N≈14k) is underpowered to detect individual variants, these estimates are for correcting and interpreting effect sizes, not variant discovery.

Reference
van Alten, S., Domingue, B. W., Faul, J., Galama, T., & Marees, A. T. (2025). Correcting for volunteer bias in GWAS increases SNP effect sizes and heritability estimates. Nature Communications, 16, 3578.

Does the Genetic and Environmental Composition of Income Change Before and After the Birth of the First Child? Possible Gene-Environment Interplay in a Nordic Welfare State

Ebeltoft JC1,*, Burt SA2


1PROMENTA, Faculty of Social Science, University of Oslo, Norway
2College of Social Science, Michigan State University, USA

*Presenting author: Joakim Coleman Ebeltoft
Corresponding author email: joakimeb@uio.no

Short Abstract

Background: Becoming a parent is a profound and life-altering experience for many adults, particularly following the birth of their first child. Existing evidence suggests that parenthood affects nearly every aspect of their lives, including their career trajectories, health, overall well-being, and income dynamics. Much of prior work is focused on how parent outcomes change following the birth of a first child, such as the well-documented drop in mothers’ income. However, we have yet to consider whether and how sources of variation underpinning income might change following the birth of a child. In particular, does having children alter the relative importance of genetic and environmental influences on income?

Methods: Here we apply quantitative genetic family pedigree designs to Norwegian population-wide registry data on relatedness and yearly income. Rather than relying solely on twin samples or molecular genetic data, we exploit the full national kinship structure to explore how additive genetic, shared environmental, and non-shared environmental variance components contribute to income before and after parenthood. Using annual income records, we compare the genetic and environmental contributions to income in the years before and after the birth of the first child in Norwegian relatives (5797 twin pairs, 415,400 sibling pairs, and 712,380 first cousin pairs). This design illustrates how large-scale administrative data can be used to study the genetic and environmental architecture of social outcomes, and allows us to assess whether the balance of these influences on income shifts following the transition to parenthood. We conduct sensitivity analyses to probe assumptions about shared environment correlations, age and gender income associations, income volatility and variability, and alternative definitions of income.

Results: Descriptive analyses show that pairwise correlations for income in twin pairs, sibling pairs and first cousin pairs increased after the birth of the first child. Initial population-wide family pedigree analyses indicate both increases in genetic and shared environmental influences, with genetic influences increasing the most. Planned sensitivity and robustness checks will nuance these preliminary results and help assess how sensitive the observed changes in the variance structure are to alternative assumptions.

Discussion: Our early findings suggest that parenthood not only changes income levels, but may also reshape the proportions of coarse-grained sources of variation. The observed increase in genetic and shared environmental influences on income after parenthood is consistent with widespread gene-environment interplay, in which the transition to parenthood modifies the importance of underlying differences. Our design is descriptive and cannot distinguish specific mechanisms, which should be examined in future research. Importantly, these findings arise within the Norwegian Nordic welfare-state context, where strong redistributive and family-support policies may shape the ways in which genetic and environmental factors jointly contribute to income in the transition to parenthood.

Effects of Genetic Propensity for Education on Labor Market and Health Trajectories across the Working Life

Lombardi S1,2,3,†,#, Jandarova N4,†, Zguro K5,†, Harju J4, Rustichini A6,*, Ganna A5,7,8,#


1VATT Institute for Economic Research, Helsinki, Finland
2IFAU and Uppsala Center for Labor Studies, Uppsala, Sweden
3IZA, Bonn, Germany, and Rockwool Foundation, Berlin, Germany
4Economics Department, Tampere University, and FIT, Tampere, Finland
5Institute for Molecular Medicine Finland (FIMM), HiLIFE, University of Helsinki, Finland
6Economics Department, University of Minnesota, MN, USA
7Broad Institute of MIT and Harvard, MA, USA
8Analytic and Translational Genetics Unit, Massachusetts General Hospital, MA, USA

†Co-first authors
*Presenting author: Aldo Rustichini
#Corresponding author emails: andrea.ganna@helsinki.fi (Andrea Ganna), stefano.lombardi@vatt.fi (Stefano Lombardi)

Short Abstract

Education is a major source of inequality in income and health. Polygenic indices for educational attainment (EA-PGI) capture both direct and indirect genetic influences on education, but their effects on income and health remain unclear. Using Finnish registry data on 51,056 graduates followed annually since graduation for up to 25 years, we report three findings. First, higher EA-PGI strongly predicts income growth, but only among higher-educated people: tertiary-educated graduates at the 90th percentile earn €45,392 (13.1%) higher discounted lifetime income than those at the 10th percentile. This effect is not mediated by overall health and is entirely absent for the secondary (high school)-educated workers, who do not benefit from higher EA-PGI levels. Second, EA-PGI does not predict income differences at labor market entry or the quality of the first employer, but rather a higher job-to-job mobility toward higher-quality firms that drives the long-run income divergence. Third, controlling for parental EA-PGI in 12,871 parent–offspring trios reduces the discounted lifetime income gap by 71%, and the effect of paternal (but not maternal) EA-PGI on offspring income exceeds that of the offspring’s own EA-PGI. These findings suggest that genetic factors associated with educational attainment predict income trajectories primarily through faster and more frequent changes to higher-paying employers. However, much of this association reflects indirect paternal genetic effects, consistent with enduring paternal patterns of intergenerational job and income transmission.

Classification: Social Sciences, Economics; Biological Sciences, Genetics
Keywords: income inequality; polygenic index; gene-environment interaction; firm pay premia; income and health trajectories

Polygenic Indices and Pathways to Educational Attainment and Early Career Outcomes

Akimova ET1,2,*, Wang WJ3, Stryker R1


1Department of Sociology, Purdue University
2Statistics Department, Purdue University
3Department of Sociology, Princeton University

*Presenting author: Evelina T. Akimova
Corresponding author email: eakimova@purdue.edu

Short Abstract

A central concern in stratification research is identifying the channels through which inequality is reproduced. Sociologists have long examined family socioeconomic background, cognitive ability, aspirations, and encouragement from significant others, but only recently has the field begun to consider whether and how genetic differences enter the stratification process. Polygenic indices (PGIs), which aggregate information from genetic variants associated with complex behaviors and outcomes, allow researchers to examine whether genetic correlates of educational attainment shape educational and occupational outcomes directly or operate indirectly through the social processes emphasized in classical status-attainment models. While genetic influences are not deterministic, they contribute to individual differences that interact with social environments across the life course. Incorporating PGIs therefore extends debates about equality of opportunity by clarifying whether inequalities linked to genetic differences are immutable or socially mediated. Adopting Stryker’s (1981) framework, consistent with the status-attainment models developed by Sewell and Hauser (1972), we ask whether the polygenic index for educational attainment (EA-PGI) influences educational attainment and early career outcomes directly or operates primarily through established social and social psychological mechanisms. We use data from the Wisconsin Longitudinal Study, which follows a cohort of Wisconsin high school graduates over the life course and includes genetic data alongside detailed measures of family background and social psychological processes. Using structural equation modeling, we decompose EA-PGI effects on years of education and first-job socioeconomic status into direct and indirect pathways through cognitive skills, parental and teacher encouragement, peers’ college plans, attitudes toward college, and respondents’ educational and occupational aspirations. By integrating genetic data with sociological theory, this paper shows that genetic correlates measured via PGIs operate largely through socially structured pathways shaping educational and early career trajectories.

From Glucocorticoid Response to Cellular Composition: Interpreting DNA Methylation Biomarkers of Stress

Merrill SM*, Edwards K, Konwar C, Fu MP, MacIsaac JL, Letourneau NL, Dewey D, Ponsonby A-L, Mansell T, Saffery R, Bush NR, Czamara D, Binder E, Kobor MS


*Presenting author: Sarah Merrill
Corresponding author email: Sarah_Merrill@uml.edu

Short Abstract

Composite DNA methylation (DNAm) biomarkers are increasingly used to summarize high-dimensional molecular data into quantitative measures of environmental exposures and biological processes. Their interpretation, however, is complicated by cellular heterogeneity. DNAm is fundamental to cell identity, and many CpGs differ substantially across immune cell lineages. Consequently, a DNAm biomarker measured in heterogeneous blood may capture both DNAm variation within cells and differences in the relative abundance of the cells being measured. This distinction is particularly important for biomarkers of stress, as glucocorticoids themselves alter circulating immune cell composition.

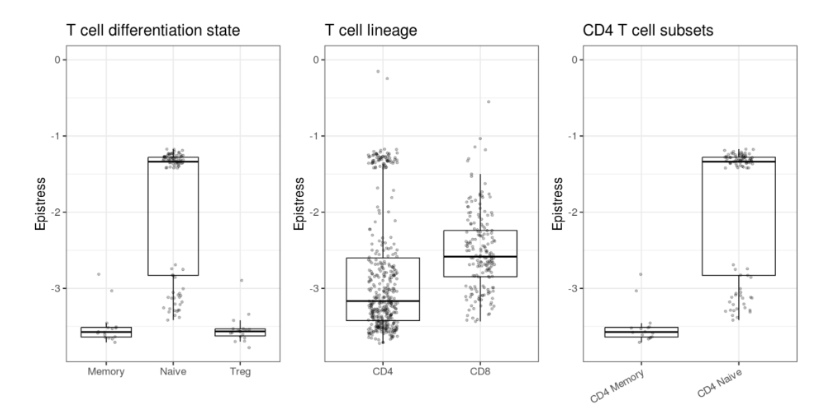
We investigated this problem using EpiStress, a 24-CpG polyepigenetic score originally developed from glucocorticoid-responsive DNAm sites identified in peripheral blood and neuronal progenitor cells. We evaluated EpiStress across thousands of samples spanning multiple cohorts, ages, array platforms, tissues, blood preparations, and purified immune cell populations. We tested whether EpiStress varied systematically across cell types and biospecimens and evaluated lineage-specific DNAm of the CpGs comprising EpiStress.

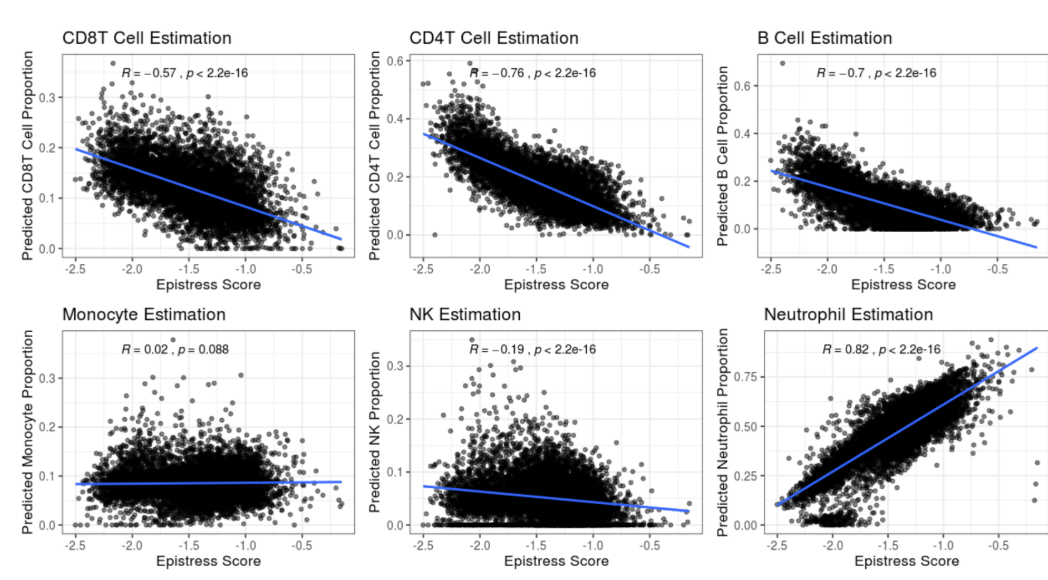
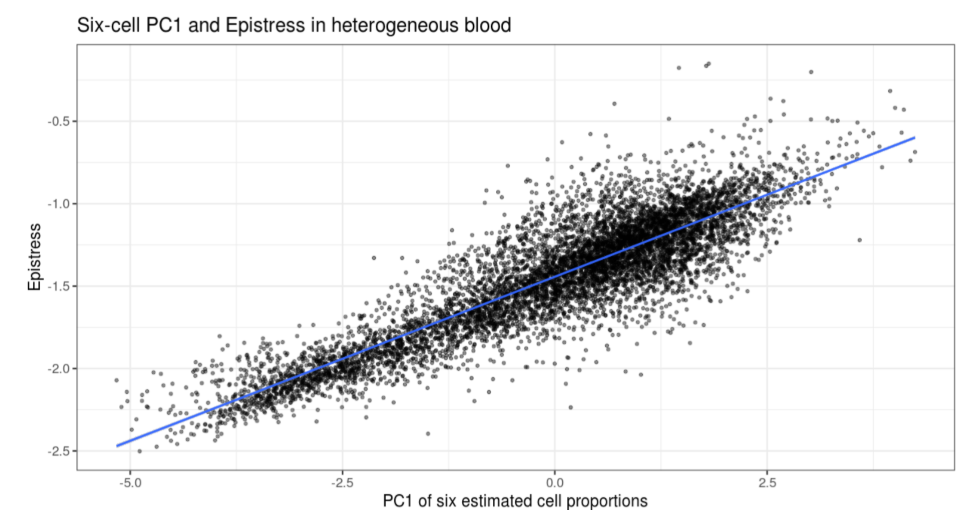
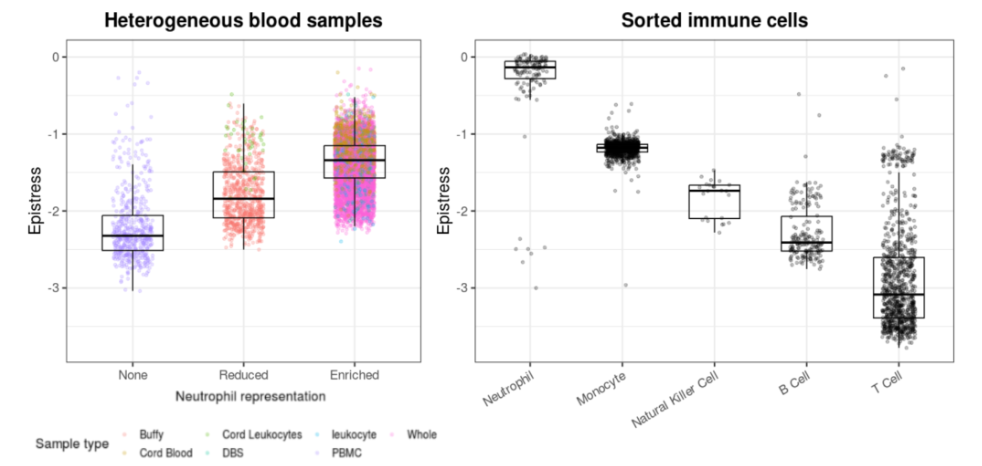
EpiStress score differed substantially across blood preparations and purified immune populations. In heterogeneous blood, higher EpiStress values were strongly associated with greater neutrophil representation and lower lymphoid representation. Estimated major immune cell proportions collectively explained 85.5% of EpiStress variance. EpiStress was also strongly correlated with the primary multivariate axis of immune composition, characterized by opposing neutrophil and adaptive lymphocyte contributions. This structure was substantially attenuated when granulocytes were absent. In peripheral blood mononuclear cells, the range of EpiStress values was compressed and variation instead aligned most strongly with monocyte versus lymphocyte composition. Similar tissue dependence was apparent in oral samples, where EpiStress scores were inflated and varied primarily with epithelial versus immune cell composition rather than the granulocyte-lymphocyte structure observed in whole blood.

CpG-level analyses provided a structural explanation for these associations. Although the EpiStress CpGs were not intentionally selected as cell-type markers and were significantly associated with glucocorticoid exposure across tissues, all 24 demonstrated lineage-specific differential DNAm across three independent sorted immune-cell reference frameworks. Many showed DNAm differences exceeding 0.6 to 0.8 between major immune lineages. More broadly, upon examining CpGs measured across Illumina DNAm microarray technologies, lineage-sensitive CpGs were common, making up the majority of characterized DNAm, indicating that this issue is unlikely to be unique to EpiStress.

These findings raise a fundamental interpretive problem for DNAm biomarkers of stress. Glucocorticoid activity produces well-characterized changes in circulating leukocyte populations, including increased neutrophil representation and reduced lymphocyte representation. Thus, cellular composition may not simply constitute unwanted technical variation in a glucocorticoid biomarker. Instead, the cellular redistribution captured by the score may itself represent part of the biological response to glucocorticoid signaling. At the same time, a biomarker dominated by this cellular axis cannot readily distinguish glucocorticoid-associated cellular redistribution from DNAm changes occurring within cells and may not generalize to tissues with different cellular architecture.

Together, these analyses illustrate a broader challenge for composite DNAm biomarker development. When the exposure of interest alters cellular composition, removing cell-associated variation may remove meaningful biology, whereas retaining it can produce biomarkers dominated by differences in cell mixture that are not solely attributable to the exposure. Understanding how to interpret a DNAm biomarker therefore requires moving beyond statistical adjustment for estimated cell proportions and directly evaluating the cellular architecture of the CpGs from which the biomarker is constructed.

Figures

Figure 1
Figure 1.
Figure 2
Figure 2.
Figure 3
Figure 3.
Figure 4
Figure 4.

Typical Biological Dynamics in Early Childhood: Implications for Biological Embedding and Epigenetic Aging

Edwards K*; Konwar C; Zhuang BC; MacIsaac JL; Mandhane P; Simons E; Moraes TJ; Azad MB; Subbarao P; Turvey S; Kobor MS; Merrill SM


*Presenting author: Karlie Edwards


Abstract

Early childhood is a sensitive developmental period characterized by rapid biological change. Molecular measures are increasingly used to investigate developmental processes and biological embedding, yet their interpretation requires an understanding of typical biological variation during this period. Leveraging a Canadian longitudinal pediatric cohort with repeated DNA methylation (DNAm) measures at ages 1 and 5 years, we first characterized age- and sex-related differences in immune cell composition and immune-associated DNAm. DNAm-based computational cell-type deconvolution revealed significant changes across all estimated immune cell populations between ages 1 and 5 years, with notable sex differences. We additionally identified distinct age- and sex-associated DNAm signatures, with sex-associated differences demonstrating greater consistency across early childhood and partial replication in independent pediatric cohorts. Together, these findings demonstrate substantial immune system remodeling during early life and highlight the dynamic nature of biological development prior to puberty.

These observations raise important questions regarding the interpretation of epigenetic age acceleration (EAA), a measure widely used as an indicator of biological aging, including in pediatric populations. Although extensively characterized in adults, it remains unclear whether EAA in early childhood reflects biological aging, developmental processes, or both. Using multiple epigenetic clocks and alternative cell-composition adjustments, we evaluated longitudinal patterns of EAA within this cohort. While some children maintained relatively stable EAA across time, others exhibited marked shifts in relative EAA ranking between ages 1 and 5 years. We further examined gestational epigenetic age acceleration (GEAA) using cord blood samples collected from the same children and found no association between GEAA and childhood EAA, suggesting limited continuity between prenatal and postnatal age acceleration measures.

Ongoing analyses across multiple longitudinal pediatric cohorts spanning infancy through childhood will further characterize EAA trajectories and their relationship to immune development and later health outcomes. Collectively, these findings suggest that molecular measures commonly interpreted as indicators of biological aging may also capture ongoing developmental processes. Establishing typical developmental trajectories may therefore be an important prerequisite for distinguishing biological embedding from developmental variation in early life.

DNAmAL: A DNA Methylation-Based Measure of Allostatic Load developed in the National Longitudinal Study of Adolescent to Adult Health (Add Health)

Aiello AE1,*; Ryan C1; Martin C2; Gaydosh L2; Dingra R3; Belsky DW1; Harris KM1


1Robert N. Butler Columbia Aging Center, Columbia University, New York, NY, USA
2Carolina Population Center, University of North Carolina at Chapel Hill, Chapel Hill, NC, USA
3School of Medicine, University of North Carolina at Chapel Hill, Chapel Hill, NC, USA

*Presenting author: Allison E. Aiello
Presenter email: aea27@cumc.columbia.edu


Abstract

Allostatic load refers to cumulative wear and tear on physiological systems that results from chronic exposure to stressors. Although allostatic load has been studied for nearly three decades, there is no standardized measurement protocol. First proposed as an index of clinically-abnormal values across ten blood-chemistry markers, anthropometric, and blood-pressure assessments, allostatic load is now operationalized with varied sets of measurements and thresholds in epidemiological research. Lack of standardization has hampered clinical translation and complicated efforts to compare results across studies. Here we introduce a novel DNA methylation-based allostatic load index “DNAmAL” developed using data from the National Longitudinal Study of Adolescent to Adult Health (Add Health). Data included Add Health (N= 4,073) and several replication datasets (Health and Retirement Survey up to n=3483, Framingham Heart Study n=2069 and Women’s Health Initiative n=1835), we found that DNAmAL predicts clinical allostatic load index, is associated with but distinct from epigenetic clock measures of biological aging and demonstrates sensitivity and dose-responsiveness to histories of stressful exposures. It also predicts chronic metabolic conditions, healthspan, and lifespan in data from our three independent replication cohorts of older adults.

Uncovering the Hidden Magnitude of Within-Race/Ethnicity Skin Tone Inequality

Zhang L1,*; Menon V1; Trejo S1,2,#


1Office of Population Research, Princeton University, Princeton, NJ, USA
2Department of Sociology, Princeton University, Princeton, NJ, USA

*Presenting author: Luyin Zhang
#Corresponding author: samtrejo@princeton.edu


Abstract

Decades of research have linked skin tone to meaningful inequalities in health and social outcomes among individuals of the same race/ethnicity. Yet efforts to document and understand within-race/ethnicity skin tone stratification have been hampered by a fundamental data problem: in most social surveys and biomedical databases, skin tone is either measured imprecisely or not collected at all. In this study, we begin by conducting an online survey to quantify the reliability of existing interviewer-rated skin tone measures. Then, using elastic net regression, we build a genomic prediction model for skin tone among Black and Hispanic participants in the Add Health study, with the goal of improving the accuracy and availability of skin tone measurement in admixed populations. Finally, we use these DNA-based skin tone measures in Add Health and the Health and Retirement Study to explore within-race/ethnicity skin tone-related social stratification in contemporary America. Predicted skin tone yields substantially steeper gradients with socioeconomic status and racial classification than interviewer-rated skin tone, indicating that widely used interviewer-reported skin tone measures tend to underestimate inequality within racial/ethnic groups. Our results suggest that genetically derived skin tone predictions represent a promising new tool for advancing research on colorism – and, via the ancestry disequilibrium regression framework we introduce, a path toward identifying the causal effects of skin tone.

Genetic Selectivity in Migration: Polygenic Insights into Heterogeneous Outcomes of Domestic Migration in the US

Liu Y1,*


1Sociology Department, Princeton University, Princeton, NJ, USA

*Presenting author: Yuxin Liu
Corresponding author email: yl9858@princeton.edu


Short Abstract

What makes migrant outcomes so different? Migration studies often grapple with selection bias and unobserved confounders, such as education, socioeconomic status (SES), and health, which complicate the understanding of migration outcomes. This study leverages genetic data to address these challenges, utilizing polygenic scores (PGS) to examine the genetic selectivity of various types of internal migration in the United States. Employing data from AddHealth, the research investigates the genetic profiles of U.S. migrants, focusing on traits such as educational attainment, health, and behavioral traits. Beyond the aggregated-level picture, it specifically attends to the different genetic profiles and selectivity among various types of migrants, especially long-distance and short-distance migrants.

The study proceeds in three steps: (1) identifying heterogeneity among migrants, (2) comparing genetic profiles across different migration groups to assess the direction and magnitude of genetic selectivity, and (3) employing within-family designs to establish causal relationships between genetic traits and migration behaviors. Specifically, it explores whether long-distance migrants exhibit positive genetic selectivity (e.g., higher PGS for educational attainment and health) while short-distance, frequent movers display negative selectivity (e.g., higher PGS for risk-prone behaviors and lower SES).

By integrating genetic insights with sociological perspectives, this research aims to reconcile two competing theories of migration outcomes—one emphasizing the advantages of positively selected migrants and the other highlighting the challenges faced by disadvantaged movers. This study offers innovative methodological contributions and practical implications for addressing disparities among migrant populations in the U.S.

Theoretical Framework

Two competing models exist for the understanding of migration selectivity and outcomes. The first approach suggests that migration requires determination and resources and therefore is positively selected and leads to advantageous results (Chiswick, 1999; Feliciano, 2005; Abramitzky & Boustan, 2017; Aksoy & Poutvaara, 2021). The second approach, by contrast, argues that migration produces broken social ties and interrupted routines, thus bringing about negative consequences such as increased delinquency. The second approach also suggests that migration attracts risk-seeking people and those with disadvantaged socioeconomic status, especially among short-distance, frequent, and compelled movers (Garboden et al., 2017; Kogan et al., 2011; Sharkey & Sampson, 2010).

The two theories, in fact, are not mutually exclusive; they point in conflicting directions only because they are built on different sets of assumptions. The first positive model assumes that migrants are voluntarily choosing to relocate to achieve specific economic goals, and once they succeed their improved situation will yield better outcomes. This applies more effectively to long-distance migrants. On the other hand, the second approach attends to the fact that many migrants are less self-driven and more dependent on environmental constraints. Short-distance, more frequent migration is usually included in that interpretation. This study attempts to use empirical analysis to evaluate these two seemingly conflicting theories by disentangling the genetic profile of migrants and the migration outcomes.

Methods

This study will proceed in three main steps. First, migration groups that are both theoretically and empirically different in terms of migration behavior and outcomes are identified, including migration distance, migration intention, sending and receiving communities, gender, age, etc. Migration distance will be the most discussed category, where short-distance migrants are defined as those moving within the same neighborhood (5km radius) and long-distance migrants move further than 160km.

Second, I compare the PGI for educational attainment, behavioral traits, and health measures across different migration groups. These comparisons will include migrants versus non-migrants, as well as long-distance, less frequent migrants versus short-distance, more frequent migrants. This comprehensive analysis will provide a detailed and nuanced understanding of the genetic selectivity of migrants across diverse contexts.

Lastly, I will evaluate whether the genetic selectivity found in previous steps is indeed causally correlated with migration behavior by adopting a within-family design. By controlling for parents’ genotype, the randomly inherited genetic variants can serve as a natural experiment to address the identification issues of confounding and reverse causation (Davies et al., 2018). Mendelian imputation will be utilized to calculate the parents’ genotype when one of the parents’ data is missing (Young et al., 2022).

Hypothesis
  1. Long-distance migrants are genetically positively selected in terms of health, socioeconomic status, and behavioral traits, while short-distance, more frequent movers have negative genetic selectivity.
  2. Those with a higher genetic propensity to move long distances, regardless of their actual migration actions, also have a higher genetic propensity for better socioeconomic status and health.
  3. The positive and negative genetic profiles found in previous sections are causally related to long- and short-distance mobility behaviors.
Bibliography

Abramitzky, R., & Boustan, L. (2017). Immigration in American Economic History. Journal of Economic Literature, 55(4), 1311–1345. https://doi.org/10.1257/jel.20151189

Aksoy, C. G., & Poutvaara, P. (2021). Refugees’ and irregular migrants’ self-selection into Europe. Journal of Development Economics, 152, 102681. https://doi.org/10.1016/j.jdeveco.2021.102681

Chiswick, B. (1999). Are Immigrants Favorably Self-Selected? American Economic Review, 89(2), 181–185. https://doi.org/10.1257/aer.89.2.181

Davies, N. M., Holmes, M. V., & Davey Smith, G. (2018). Reading Mendelian randomisation studies: A guide, glossary, and checklist for clinicians. BMJ (Clinical Research Ed.), 362, k601. https://doi.org/10.1136/bmj.k601

Feliciano, C. (2005a). Does Selective Migration Matter? Explaining Ethnic Disparities in Educational Attainment among Immigrants’ Children. The International Migration Review, 39(4), 841–871.

Furuya, S., Liu, J., Sun, Z., Lu, Q., & Fletcher, J. M. (2023a). The Big (Genetic) Sort? A Research Note on Migration Patterns and Their Genetic Imprint in the United Kingdom. Demography, 60(6), 1649–1664. https://doi.org/10.1215/00703370-11054960

Furuya, S., Liu, J., Sun, Z., Lu, Q., & Fletcher, J. M. (2023b). Understanding Internal Migration: A Research Note Providing an Assessment of Migration Selection With Genetic Data. Demography, 60(6), 1631–1648. https://doi.org/10.1215/00703370-11053145

Garboden, P. M., Leventhal, T., & Newman, S. (2017). Estimating the Effects of Residential Mobility: A Methodological Note. Journal of Social Service Research, 43(2), 246–261. https://doi.org/10.1080/01488376.2017.1282392

Kogan, I., Kalter, F., Liebau, E., & Cohen, Y. (2011). Individual Resources and Structural Constraints in Immigrants’ Labour Market Integration. In M. Wingens, M. Windzio, H. de Valk, & C. Aybek (Eds.), A Life-Course Perspective on Migration and Integration (pp. 75–100). Springer Netherlands. https://doi.org/10.1007/978-94-007-1545-5_4

Kihara, T. (2022). Socioeconomic selectivity of Japanese migration to the continental United States during the Age of Mass Migration. Journal of Ethnic and Migration Studies, 48(11), 2577–2600. https://doi.org/10.1080/1369183X.2021.1963219

Sharkey, P., & Sampson, R. J. (2010). Destination Effects: Residential Mobility and Trajectories of Adolescent Violence in a Stratified Metropolis. Criminology, 48(3), 639–681. https://doi.org/10.1111/j.1745-9125.2010.00198.x

Wang, J. Y., Lin, N., Zietz, M., Mares, J., Narasimhan, V. M., Rathouz, P. J., & Harpak, A. (2024). Three Open Questions in Polygenic Score Portability. bioRxiv, 2024.08.20.608703. https://doi.org/10.1101/2024.08.20.608703

Young, A. I., Nehzati, S. M., Benonisdottir, S., Okbay, A., Jayashankar, H., Lee, C., Cesarini, D., Benjamin, D. J., Turley, P., & Kong, A. (2022). Mendelian imputation of parental genotypes improves estimates of direct genetic effects. Nature Genetics, 54(6), 897–905. https://doi.org/10.1038/s41588-022-01085-0
Socioeconomic Determinants and Biological Aging: Exploring the Potential Mediating Role of Environmental Exposures in the Canadian Longitudinal Study on Aging

Kurowski A1,2,*; Engelbrecht HR2,3,4; Kobor MS2,3,4,5; Stringhini S1,2,#


1School of Population and Public Health, Faculty of Medicine, University of British Columbia, Vancouver, BC, Canada
2Edwin S. H. Leong Centre for Healthy Aging, Faculty of Medicine, University of British Columbia, Vancouver, BC, Canada
3Centre for Molecular Medicine and Therapeutics and Department of Medical Genetics, University of British Columbia, Vancouver, BC, Canada
4British Columbia Children’s Hospital Research Institute, Vancouver, BC, Canada
5Program in Child and Brain Development, Canadian Institute for Advanced Research (CIFAR), Toronto, ON, Canada

*Presenting author: Amanda Kurowski
#Corresponding author: silvia.stringhini@ubc.ca


Abstract

Socioeconomic disadvantage and environmental exposures, such as air pollution measured through estimated PM2.5 levels, have both been associated with accelerated biological aging. This study explores the associations between adult socioeconomic conditions, such as household income and highest education obtained, and multiple DNA methylation–based markers of aging, and further examines whether environmental exposures, particularly air pollution, may mediate these relationships.

Data are drawn from the Canadian Longitudinal Study on Aging, a large, population-based cohort that recruited 51,338 community-dwelling individuals aged 45–85 years between 2011 and 2015, with follow-up planned every three years until 2033 or death. A subset of 1,478 participants from the Comprehensive cohort provided baseline blood samples for DNA methylation profiling. From these data, four measures of accelerated biological aging were estimated: PhenoAge, GrimAge, DunedinPACE, and the Intrinsic Capacity clock, a novel measure of accelerated aging.

Regression analyses will be conducted to assess associations between socioeconomic indicators and each aging measure independently. Mediation analyses will also be performed to evaluate the extent to which environmental exposures, such as PM2.5, act as potential mechanisms linking socioeconomic disadvantage to accelerated aging. This work aims to contribute to a growing body of evidence on the biological pathways through which social and environmental conditions influence aging.

Social epigenomics and the biology of health equity

McCulley M1,*; Manukonga J1; Cate L1; Campbell A1; Wilkes S1


1Social Epigenomics and Health Equity Research Collective NZGSM, University of Waikato, Hamilton, New Zealand

*Presenting author: Associate Professor Michelle McCulley
Corresponding author email: Michelle.McCulley@waikato.ac.nz


Abstract

Background/context: Health inequities between Indigenous and settler populations persist after adjustment for healthcare access, behaviour, material deprivation, and measured genetic propensity. Social epigenomics offers a mechanism for the residual: adversity (colonisation, racism, chronic stress) becomes biologically embedded through epigenetic regulation, measurable as accelerated epigenetic ageing. The field carries three hazards: biological determinism, the conflation of socially defined race with ancestry, and extractive research that treats communities as subjects rather than governing partners. We introduce a research collective grounded in Aotearoa, New Zealand that turns these constraints into a contribution, arguing that whakapapa (genealogy), the braided-rivers weaving of mātauranga Māori (Māori knowledge) with empirical science, and Māori data sovereignty, together model trustworthy research the wider field needs.

Data: We invert the usual focus on harm. In a discovery analysis of the publicly available United States NHANES (CDC National Health and Nutrition Examination Survey) DNA-methylation subsample (n = 2,532, survey-weighted), cumulative social adversity (an index of education, food security, and the poverty–income ratio) predicted faster epigenetic ageing on both a pace-of-ageing clock and PhenoAge (~1.3 years of acceleration per SD). Faster epigenetic ageing predicted mortality: an older-than-expected epigenome meant dying roughly five years sooner. We identified “resilient agers”, individuals ageing more slowly than their adversity predicts, as a residual that predicted mortality beyond adversity itself, with the most resilient agers having roughly half the mortality hazard of the fastest agers over ~17 years (1,361 deaths). Physical activity was protective and current smoking and heavy drinking were risks, though activity lowered ageing across the adversity range rather than specifically buffering it.

Application/translation: We are now testing these findings in a pre-registered confirmation in independent cohorts (HRS and ELSA) that adds social support (perceived availability of emotional and family/community support), the nearest measurable proxy for relational, collective wellbeing (whanaungatanga) and asks whether such resources buffer adversity’s biological cost. Studying who resists, and what might help others recover, reframes the biology of disadvantage from a ledger of damage into a set of targets for support.

Negative Life Events and the Monthly Dynamics of Psychological Well-Being and Cognition

Angrisani M1; Cole S1,*; Faul J2; Galama T1,3,4,5; Kapteyn A1


1University of Southern California, Center for Economic and Social Research, Los Angeles, CA, USA
2Survey Research Center, Institute for Social Research, University of Michigan, Ann Arbor, MI, USA
3Department of Economics, Vrije Universiteit Amsterdam, Amsterdam, Netherlands
4Erasmus University Rotterdam, Rotterdam, Netherlands
5Tinbergen Institute, Amsterdam, Netherlands

*Presenting author: Samuel Cole
Corresponding author email: sc_652@usc.edu

Abstract

Panel evidence on how psychological well-being responds to negative life events, such as bereavement, financial loss, or illness, typically comes from surveys fielded once a year. Annual measurement cannot distinguish a null effect from a sharp drop followed by rapid recovery, and cannot date the response relative to the event with precision. We study the within-person dynamics of psychological well-being and perceived cognitive functioning at monthly frequency using the Understanding America Study (UAS) Monthly Panel, a national probability internet panel that has surveyed its adult members at the start of every month since October 2023. The data contain about 300,000 person-month observations on roughly 14,600 respondents. Each month, respondents report whether they experienced a negative health event (e.g., cancer diagnosis), a negative financial shock (e.g., job loss), or the death of a close family member or friend since their previous interview. They also complete computer-adaptive PROMIS assessments of anger, positive affect, meaning and purpose, and perceived cognitive functioning, along with the PHQ-4 anxiety and depression screener and measures of life satisfaction and self-rated health.

We estimate event-study models with individual and month fixed effects, and find that well-being deteriorates in the month a negative life event occurs. Positive affect falls by about 0.11 standard deviations after a health event and 0.16 standard deviations after a financial shock, anxiety and depression symptoms rise, and perceived cognitive functioning declines. Most outcomes return to within-person baselines one to three months after the event, a pace of adaptation that annual panels cannot observe. Responses vary with event severity in interpretable ways. Parental deaths raise anxiety and depression symptoms by roughly a third of a standard deviation, while deaths of distant relatives move well-being little. Financial shocks of nearly every type raise anxiety and depression, whereas affective and cognitive responses concentrate in particular events such as fraud victimization.

The next phase of this project will examine whether these responses differ by genetic predisposition. Genetic data for UAS respondents, including polygenic indices for depression and other phenotypes, are not yet available, but are expected to become available later this year and will be incorporated as they arrive. Linking molecular genetic data will allow us to test whether individuals at higher polygenic risk respond more strongly to the same events, adapt more slowly, or both. By following the same individuals every month as life events unfold, the project will study vulnerability, resilience, and gene-by-environment interplay at the frequency at which these events occur.

Sarah M. Merrill

Impact of age-related changes in buccal epithelial cells on pediatric epigenetic biomarker research

Merrill SM1,2; Konwar C2,3,4; Fatima F2,3,4; Dever K2,3,4; MacIsaac JL2,3,4; Letourneau N5,6; Giesbrecht GF6,7,8; Dewey D5,7,8; England‑Mason G6,7; Lewis CR9; Wang D10,11,12; Teh AL10,11; Meaney MJ10,13,14; Gonzalez A15; Noll JG16; De Weerth C17; Bush NR18; O’Donnell KJ19; Stewart SE2,20; Kobor MS2,3,4,14,21


1Department of Psychology, University of Massachusetts Lowell, Lowell, MA, USA
2British Columbia Children’s Hospital Research Institute, University of British Columbia, Vancouver, BC, Canada
3Department of Medical Genetics, Faculty of Medicine, University of British Columbia, Vancouver, BC, Canada
4Centre for Molecular Medicine and Therapeutics, University of British Columbia, Vancouver, BC, Canada
5Faculty of Nursing and Cumming School of Medicine, Departments of Pediatrics, Community Health Sciences and Psychiatry, University of Calgary, Calgary, AB, Canada
6Owerko Centre, Alberta Children’s Hospital Research Institute, University of Calgary, Calgary, AB, Canada
7Department of Paediatrics and Department of Community Health Sciences, Cumming School of Medicine, University of Calgary, Calgary, AB, Canada
8Hotchkiss Brain Institute, University of Calgary, Calgary, AB, Canada
9School of Life Sciences, Arizona State University, Tempe, AZ, USA
10Institute for Human Development and Potential (IHDP), Agency for Science, Technology and Research (A*STAR), Singapore, Singapore
11Bioinformatics Institute (BII), Agency for Science, Technology and Research (A*STAR), Singapore, Singapore
12National Heart and Lung Institute, Imperial College London, London, UK
13Douglas Mental Health University Institute, McGill University, Montreal, QC, Canada
14Program in Child and Brain Development, CIFAR, Toronto, ON, Canada
15Department of Psychiatry and Behavioural Neurosciences, McMaster University, Hamilton, ON, Canada
16Mount Hope Family Center and Department of Psychology, University of Rochester, Rochester, NY, USA
17Donders Institute for Brain, Cognition and Behaviour and Radboud University, Nijmegen, The Netherlands
18UCSF Weill Institute for Neurosciences, Departments of Psychiatry and Pediatrics, University of California, San Francisco, CA, USA
19Departments of Psychiatry, Psychology, and Obstetrics & Gynecology, Yale University, New Haven, CT, USA
20Department of Psychiatry, University of British Columbia, Vancouver, BC, Canada
21School of Population and Public Health, University of British Columbia, Vancouver, BC, Canada

*Presenting and corresponding author: sarah_merrill@uml.edu

Abstract

Cheek swabs are widely used in pediatric DNA methylation research, yet their heterogenous cellular composition across development has not been characterized. We examined how buccal epithelial cell (BEC) proportions change across childhood and adolescence and how these age-related shifts influence epigenetic age biomarkers in young populations. DNA methylation data from 4,626 typically developing children (2 months to 20 years; 2,154 male/2,472 female) were assembled from twelve independent cohorts. Cell-type proportions were estimated using EpiDISH with the robust partial correlation approach. Associations between BEC proportion and age were evaluated on Box–Cox transformed values with Pearson correlations and age-stratified spline models with a single knot at 10 years to capture the transition from childhood to adolescence. We further tested whether accounting for BEC proportion alters associations between Pediatric-Buccal-Epigenetic (PedBE) age acceleration and child health phenotypes.

BEC proportion declined with age across the full pediatric window (r = −0.43), with a stronger negative association from infancy through the end of childhood (r = −0.54) and no association during adolescence (r = −0.03). Estimated neutrophil proportion showed the inverse pattern. Inter-individual variability in both BEC and neutrophil proportion increased with age. Adjusting for BEC proportion changed downstream inferences for epigenetic age acceleration (EAA): in a case-control cohort of childhood-onset obsessive–compulsive disorder, including BEC proportion attenuated the association between PedBE EAA and diagnosis; in a separate cohort, adjustment strengthened the association between increased PedBE EAA and steeper diurnal cortisol slopes. These findings indicate that age-linked heterogeneity in oral cell mixtures can both inflate and obscure associations between epigenetic clocks and phenotypes in youth.

This talk will summarize evidence that cheek swab cellular composition changes meaningfully across development and will provide practical guidance for modeling BEC proportion when estimating and interpreting epigenetic age in pediatric studies. Accounting for BEC proportion improves model fit in childhood, reduces the risk of spurious associations, and clarifies biological associations with health-relevant measures.